Category: Reporting
How To See COGS (Cost Of Goods Sold)
Do you track your Cost of Goods sold? SP-1 has the ability to show you your COGS on the fly three different ways!
1) Check out the Business Summary (Reports | Daily Sales Recap | Business Summary). This will show you the current COGS. If you input a time frame, it will show the COGS for that time frame. If you display the report, you can see greater detail as we show the actual total dollar amount of the COGS as well as the percentage.

2) Dashboard method. The dashboard is a great way to quickly see COGS. Simply select the dashboard button and enter a user code and password. The COGS, and other information, will appear!
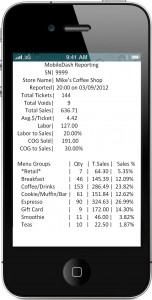
3) MobileDash method. There is a cost to the MobileDash ($10/month) but if you are using it, you will receive hourly updates to the COGS along with other information.
Posted in Reporting Tagged with: cogs, Cost Of Goods Sold
Close That Shift!
How do you handle shift changes?
SP-1 supports up to 10 shifts per day per station. This can be handled by having the employee run the 40 Column Shift Close Report or the Balance Till report. The employee then counts the money and then hands it all over or stores it in the lock box or safe. The challenge with this is if you have employee theft issues. Allowing the employee to count their own till and match it against a report can lead to them ‘adjusting’ the cash they have on hand.
Another way is to do a ‘blind shift’ close. This can be done by not allowing the employee to run the balance till or 40 column shift close reports. Then, when the employee finish their shift, they print one ticket with a comment on it. The comment will read something like “end of shift”. This receipt goes into the cash bag along with the till count.
At the end of the night or shift, the owner or trusted manager runs the shift close report and enters the ticket number off the receipt in the bag. SP-1 will automatically show you just the close out for the tickets during that shift ! While this puts a little more work on the manager or owner, it helps insure that the employees are accountable for their actions.
SP-1 also supports multiple cash drawers per station. This is another way to insure that you have accountability when changing shifts as well as making a shift change easier to do.
Finally, we support locking lids for your cash drawer as well.
Posted in Employees, Reporting Tagged with: cash drawer, shift close
Business Summary Options
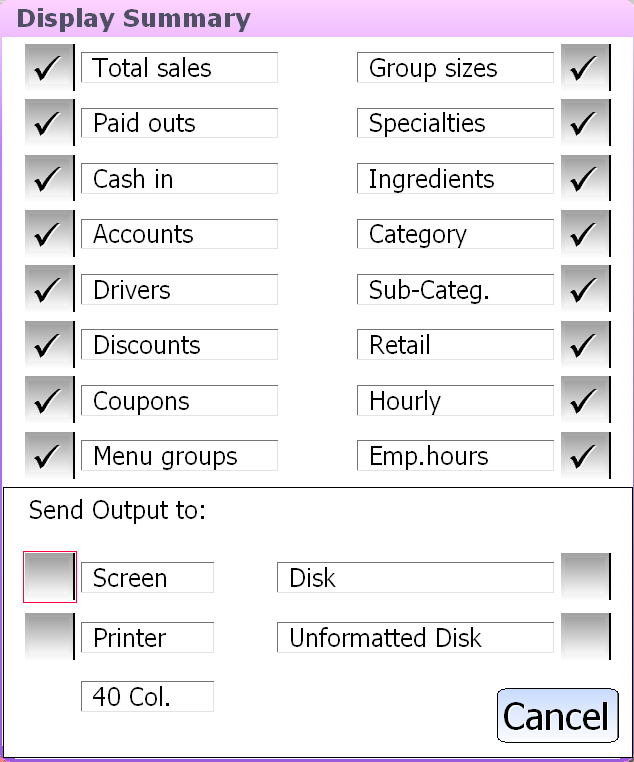
Do you use the Business Summary report in SP-1? It’s a great tool and offers a ton of information regarding your sales. The business summary is made up of sixteen sub-reports that show everything from total sales and tax to how many times someone selected an additional modifier.
Sometimes, you don’t need that level of detail every time you run the report however. SP-1 has a setting to help you default the reports that you want to run often. To set this, simply go to Reports and then Report Settings 2.
Here is a screen shot with the sixteen sub reports:
Here is the screen where you can select defaults:
Posted in Reporting Tagged with: business summary
Ticket Audits
SelbySoft has added a new feature for those of you using our Corporate package, Corporate Reporting Only package or our Enterprise software. We now have the ability to automatically include the ticket audit reporting and send it to your corporate computer. While this information has always been available, we wanted to make it easier for owners to receive it when they are offsite.
The ticket audit reports are an effective way of staying on top of potential theft issues.
Call us for more information on how to add this to your existing Corporate package.
Posted in POS Features, Reporting Tagged with: audit, Corporate package, Theft
Corporate Reporting
Do you have multiple locations? We all know that moving from store one to store 2 or 20 can be tough. You simply cannot be two places at once!
Maybe you only have one location but have quite a bit of distance to travel.
If either of these situations seem familiar, then our Corporate Reporting option is what you are looking for.
Our Corporate Reporting option is a great way to stay on top of multiple locations. The Corporate Reporting software will allow you to review reporting from any of the locations that are active right from your home, laptop or office. Once this is setup, the store locations will automatically transmit the sales information from the store to the corporate software. On the corporate side you can see any reporting information from the previous day back to the first day you used SP-1. This gives you the ability to manage the reporting for your business without having to interrupt the location.
This software package also allows you to handle multi-location gift and loyalty for free. With this option, you can seamlessly share, in real time, gift and loyalty cards between locations.
Finally our MobileDash and MobileAlerts systems are included with the purchase of the Corporate Reporting software. MobileDash allows you to receive hourly email updates from your store locations. MobileAlerts will send real-time alerts from the store when tickets are voided, audit triggers are met, employees clock in and more.
Need more? Call and ask us about our Full Corporate package and Enterprise options.
Posted in Gift Cards, Reporting Tagged with: corporate, gift cards, mobiledash, reporting
Track Your Best Selling Items
One of the best benefits of a POS system is the reporting. It’s also one of the items that a lot of people ignore! So, let’s challenge ourselves to take a look at one of the reports SP-1 has to offer.
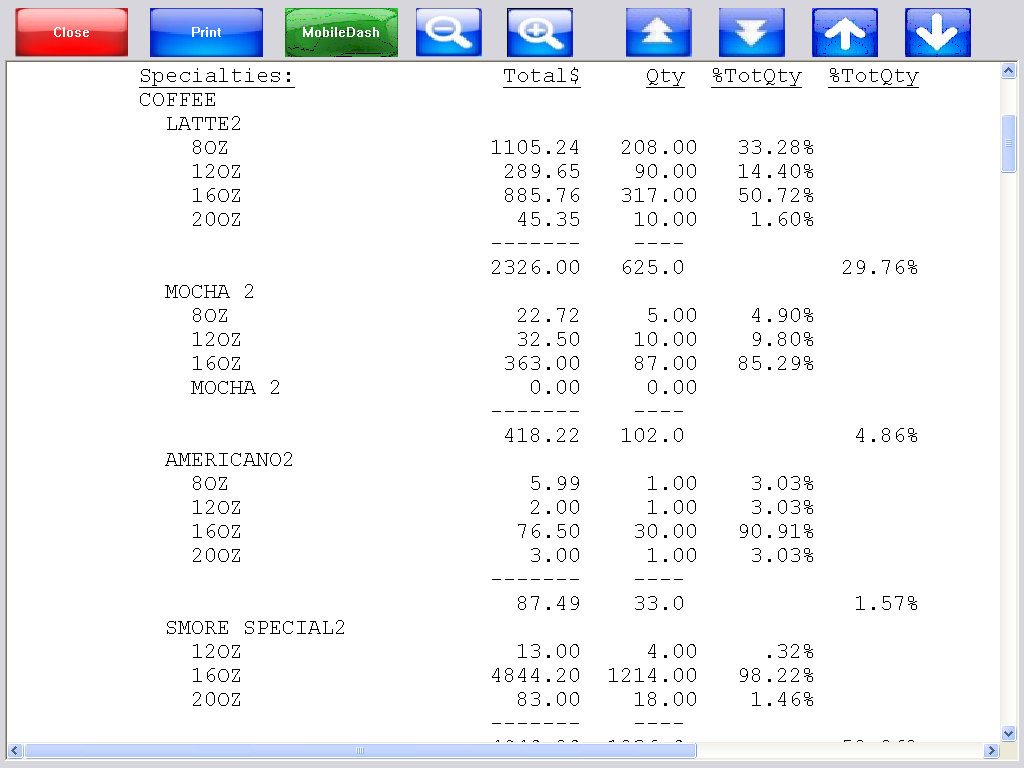
We will look at the Specialty Report in the Business Summary. In order to get there, select the Reports menu, Daily Sales Recap and then Business Summary. Run that for a time frame (you can run that for any time you have been open after all). Select Display and make sure the Specialties option is selected.
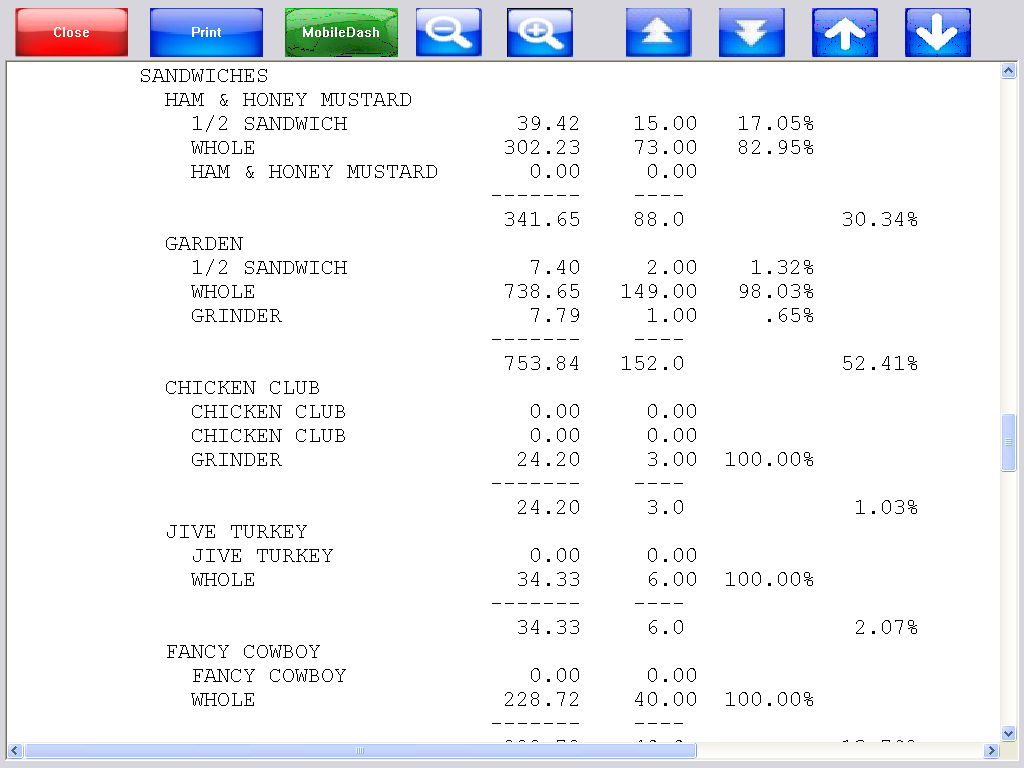
The pictures below show an example of this report.
This report first breaks down sales by Menu Group: Coffee, pizza, sandwich, pastries. Then by specialty item: Latte, mocha, meat lovers, club, blueberry muffin. Then by the size: 8, 12, small large.
We then show the total sales by dollar amount and quantity for this item by size. Finally we show a percent of total sales by category for this specialty item. This allows us to see (using the examples below) that:
Latte accounts for 29.76% of all coffee sales. Americano only accounts for 1.57% of total coffee sales however.
Ham & Honey Mustard account for 30.34% of all our sandwich sales and the Chicken Club is only 1.03% of sandwich sales.
Using this data we can decide if we need to refresh our menu, push higher profit items appropriately or simply drop carrying them.
Posted in Reporting Tagged with: menu items, specialties
3 Reports you should look at
Here are three reports that you should absolutely be looking at on a regular basis!
1) Credit Card Settlement in Reports | Daily Sales Recap. This report shows you what SP-1 recorded in credit cards. This report should be reconciled with the report from PC Charge or your credit card processor. This is the quickest way to insure that batches are processing, tips are being recording etc.
2) Business Summary Recap in Reports | Daily Sales Recap. Sure, many of you run the Business Summary but you should also be entering the deposit amounts in the fields provided. Doing this will give you the ability to see how short or over you are.
3) Employee Summary in Reports | Daily Sales Recap. This report should be run fairly often. The advantage of this is that it shows you, by employee, the total sales and voids that have been done. This will help keep track of potential issues with theft and more.
Give these a try if you are not using them! Feel free to call our support team with any questions.
3 End of year tips for SP-1
2013 is almost upon us! Let’s take a look at three end of the year tips for SP-1.
1) Make an offsite backup of your data today. Yes, if you are on a support plan with SelbySoft we backup your data nightly. It still makes sense to have a complete backup of your data available on a USB drive or stored on a computer at home or the office just in case. It is not difficult to do and our support department is here to help.
2) Review your menu sales. Take a minute and run your Business Summary report so you can look at how effective your menu item sales are. This is are great way to check and see if you need to rework the menu!
3) Check your timekeeping audit. SP-1 records an audit log every time employee hours are changed in the master files section of SP-1.
Call us if you need more information!
Posted in Employees, Reporting Tagged with: audit, backup, menu, timekeeping
SP-1 POS Dashboard
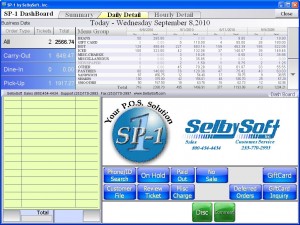
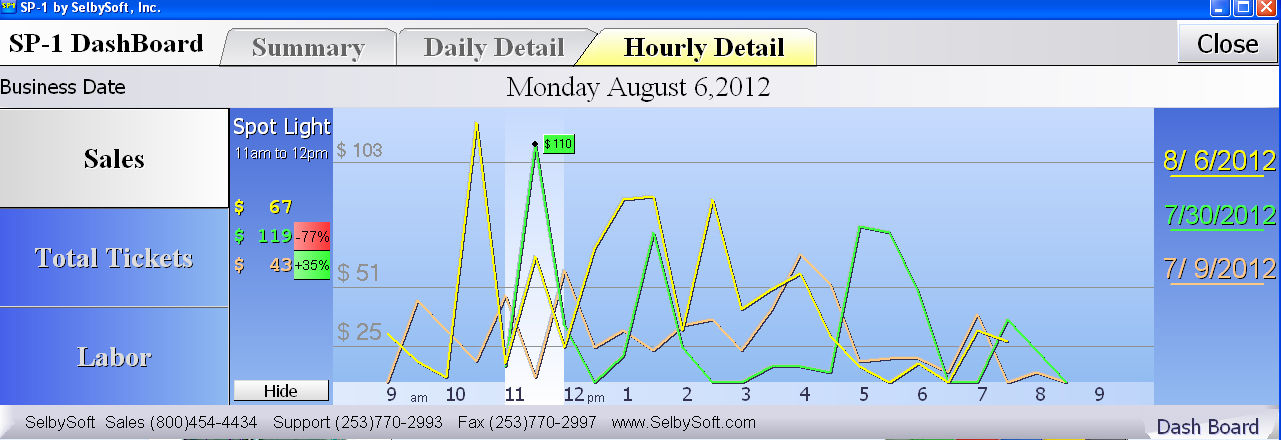
Are you aware of the Dashboard feature in SP-1? This is a great tool to help you quickly see where you are at during the day. There are four components to the dashboard system in SP-1.
1) Dashboard Main Screen: This screen shows you all the quick information about your business. Total sales, voids etc.

2) Daily Detail – This tab shows you menu group sales compared to last week, last month and last year. It’s a great way to see if you are doing better than the past.
3) Graphing. With the hourly detail tab, you can see today vrs last week, last month and last year. This tab also can show you that same information by total tickets!
4) Highlights. If you select an our with your finger or mouse, Sp-1 will compare that hour to the same hour last week, last month and last year!
Posted in Order Entry, POS Features, Reporting Tagged with: dashboard
Customer Purchase History
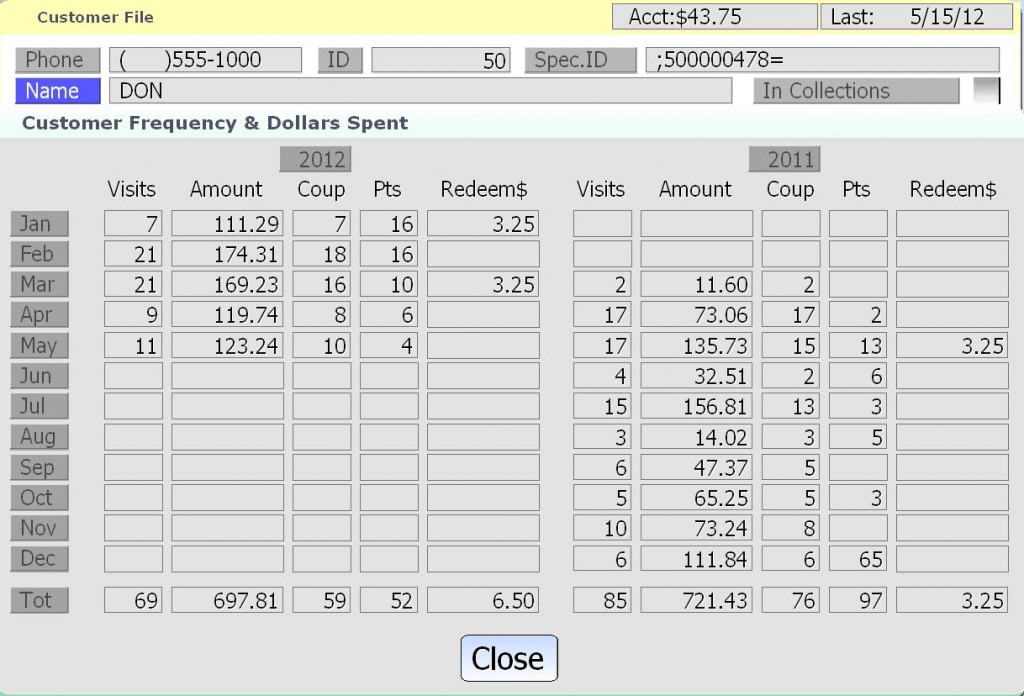
Ever wonder how often certain customers order? What about how much money they spend? If you have SP-1, you have access to as much as the last three years worth of customer purchase history right at your fingertips! Stored in the customer information, is the ability to see this information.
In the image below you can see that we track the following by month:
- Visits: Total number of times the customer visited.
- Amount: Amount of money they spent that month.
- Coup: How many times they used a coupon or discount on their transaction in that month.
- Pts: How many reward (loyalty points) they earned for that month.
- Redeem$: The value of items received through points redeemed.
Posted in Order Entry, Reporting Tagged with: customer frequency
